 A New Statistic for a New Offensive Era
By: Herb Crehan with Jackson Dunnell
OPS, on-base percentage plus slugging average, has achieved acceptance as the single-best offensive measure of a player’s value to his team. On-base percentage quantifies a player’s ability to get on base, whether it is through a hit, a walk or a hit-by-pitch. Slugging average uses total bases divided by at-bats to measure a hitter’s power. When these two measures are added together to equal OPS, we have a single metric that accurately reflects a hitter’s contribution to his team’s offense.
Like all new statistics, it took awhile for fans to accept OPS as the “gold standard” for a hitter’s value. Moneyball, the book by Michael Lewis and the movie of the same name, went a long way towards popularizing on-base percentage as superior to batting average in evaluating a hitter’s effectiveness. And when Fox baseball broadcasts made OPS a standard graphic and discussion topic, the emergence of OPS as the primary offensive benchmark was official.
But a funny thing happened during the decade it took for OPS to be widely embraced by fans. From 2003 to 2013, home run and power production fell.
In 2003, 10 MLB players hit 40 or more home runs, and an additional 20 hit between 30 and 39 home runs. Ten years later in 2013, only 2 MLB players hit 40 or more home runs, and just 9 other players hit between 30 and 39 home runs. The following table illustrates the dramatic decrease in home runs over the past ten years:
|
YEAR |
Players with 40+ Home Runs |
Players with 30-39 Home Runs |
Total 30+ Home Runs |
|
2003 |
10 |
20 |
30 |
|
2008 |
2 |
25 |
27 |
|
2013 |
2 |
9 |
11 |
Similar changes in overall power production have occurred in the past ten years. In 2003, 6 MLB players had a slugging average of .600 or better, and an amazing 42 additional players slugged between .500 and .599. In 2013, just 2 MLB players slugged .600 or better, and only 14 more players slugged between .500 and .599. Given this dramatic decrease in power production the ability to manufacture runs through stolen bases has taken on a new importance.
BOSTON RED SOX: 2003 vs. 2013
A comparison between the 2003 and 2013 Boston Red Sox shows a dramatic shift away from power-hitting towards base-running. The 2003 Red Sox led MLB in runs scored, they were second in home runs, and they lost a seven game series to the New York Yankees in the ALCS. The 2013 Red Sox led MLB in runs scored, they led MLB with a stolen base success rate of 87% (123 stolen bases in 142 attempts), and they defeated the St. Louis Cardinals in six games to win the World Series.
The 2003 Red Sox were an offensive juggernaut. The team set MLB records for extra base hits (649), total bases (2,832), and slugging average (.491). But only Johnny Damon was a legitimate stolen base threat with 30 steals, and their running style was largely station-to-station.
A comparison of slugging averages, the larger component of OPS, in both seasons illustrates the dramatic decrease in power-hitting:
|
2003 |
2013 |
||
|
Player (300 + at-bats) |
Slugging Average |
Player (300 + at-bats) |
Slugging Average |
|
Ortiz |
.592 |
Ortiz |
.564 |
|
Ramirez |
.587 |
Napoli |
.482 |
|
Nixon |
.578 |
Saltalamacchia |
.466 |
|
Mueller |
.540 |
Victorino |
.451 |
|
Garciaparra |
.524 |
Nava |
.445 |
The hitter with the fifth highest slugging average in 2003, Nomar Garciaparra at .524, exceeds Mike Napoli’s .482 second-best slugging average in 2013. In fact, Jason Varitek, sixth-best in 2003 at .512, comfortably exceeds Napoli’s .482. Clearly it wasn’t power-hitting that gave the 2013 Red Sox the MLB lead in runs scored.
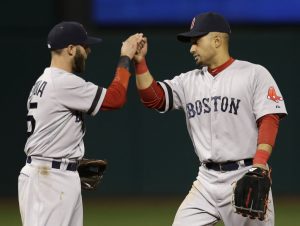
In 2013, John Farrell did so many things right that few noticed he had transitioned the one-base-at-a-time Red Sox into a team that kept the pressure on through their running game. Not only did Jacoby Ellsbury lead MLB in stolen bases, but Shane Victorino and Dustin Pedroia were in the top 25 in steals in the AL as well. Clearly stolen bases played an important role in the 2013 Red Sox MLB-leading run scoring total.
MOPS-Reflecting a Changed Game
Recognizing the declining impact of power-hitting and the increasing relative importance of stolen bases, my grandson, Jackson Dunnell, and I analyzed the enduring value of OPS as the single best measure of offensive contribution. Our conclusion is that OPS needs to be refined and improved. Our proposal is MOPS: Modified On-base Plus Slugging.
 MOPS is elegant in its simplicity. Our first premise is that if a hitter reaches base, whether by a single, a walk or a hit-by-pitch, and then steals second base, he has attained the same value as if he had doubled. Therefore, his slugging average should be adjusted upward to reflect the value of a double.
Our second premise is that if a hitter reaches base, whether by a single, a walk or a hit-by-pitch, and then is thrown out stealing second base, he has attained the same value as if he had been out initially. Thus, his on-base average should be adjusted downward for an out.
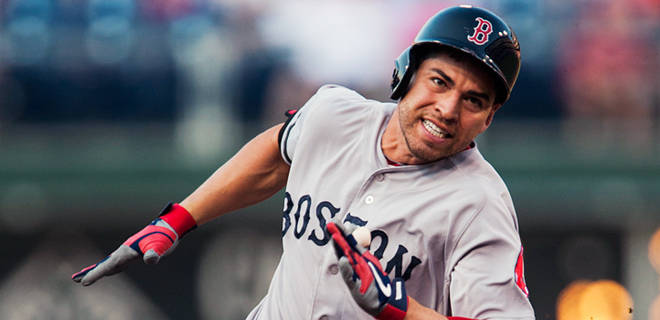
Jacoby
 Jacoby Ellsbury is the ideal “poster boy” to illustrate the calculation of MOPS. First, here is the calculation of his traditional OPS in 2013:
On-base percentage: .355
Slugging average: .426
OPS .781
MOPS is calculated in three steps. The first step in recasting OPS as MOPS is to account for the four times that Ellsbury was caught stealing. The calculation to produce his modified on-base percentage is as follows:
|
MOB Calculation |
|
| 1. Times On-Base |
226 |
| 2. Times Caught Stealing |
4 |
| 3. Modified On-Base = (1) – (2) |
222 |
| 4. Plate Appearances |
636 |
| 5. Modified On-Base Percentage = (3) / (4) |
.349 |
The second step is to account for Ellsbury’s 52 stolen bases. The calculation to produce his modified slugging average is as follows:
|
MSA Calculation |
|
| 1. Total Bases |
246 |
| 2. Stolen Bases |
52 |
| 3. Modified Total Bases = (1) + (2) |
298 |
| 4. At-Bats |
577 |
| 5. Modified Slugging Average = (3) / (4) |
.516 |
The final step is to simply add the Modified On-Base Percentage to the Modified Slugging Average:
|
MOPS Calculation |
|
| 1. Modified On-Base Percentage | .349 |
| 2. Modified Slugging Average | .516 |
| 3. MOPS = (1) + (2) | .865 |
2013 BOSTON RED SOX: OPS vs. MOPS
Now that we have outlined the calculation of MOPS, it is timely to test its value by comparing OPS and MOPS for the 2013 Red Sox. The following table ranks Boston Red Sox hitters with 300 or more at-bats according to their 2013 OPS:
|
RANK |
PLAYER |
OPS |
|
1 |
Ortiz |
.959 |
|
2 |
Napoli |
.842 |
|
3 |
Nava |
.831 |
|
4 |
Saltalamacchia |
.804 |
|
5 |
Victorino |
.801 |
|
6 |
Pedroia |
.787 |
|
7 |
Ellsbury |
.781 |
|
8 |
Drew |
.777 |
|
9 |
Gomes |
.771 |
|
10 |
Middlebrooks |
.696 |
It can be seen that Jacoby Ellsbury ranks seventh by this measure, slightly behind Dustin Pedroia, and just ahead of Stephen Drew and Johnny Gomes. A comparison of the rankings using MOPS follows:
|
MOPS RANK |
PLAYER |
MOPS |
OPS RANK |
|
1 |
Ortiz |
.965 |
1 |
|
2 |
Ellsbury |
.865 |
7 |
|
3 |
Napoli |
.842 |
2 |
|
4 |
Victorino |
.840 |
5 |
|
5 |
Nava |
.834 |
3 |
|
6 |
Pedroia |
.818 |
6 |
|
7 |
Saltalamacchia |
.812 |
4 |
|
8 |
Drew |
.792 |
8 |
|
9 |
Gomes |
.774 |
9 |
|
10 |
Middlebrooks |
.700 |
10 |
As shown above, when MOPS is introduced, the rankings change significantly. Most dramatically, Ellsbury moves from the seventh most important contributor to second place, ahead of Mike Napoli. Shane Victorino, who stole 21 bases while being caught stealing only three times, moves from fifth place to fourth, only 2 percentage points behind Napoli. And Jarrod Saltalamacchia drops all the way from fourth to seventh place.
MLB TOP 10: OPS VS. MOPS
The value of MOPS of course extends beyond the Red Sox to all of MLB. The following is the 2013 ranking of the top ten players in MLB based on OPS:
|
RANK |
PLAYER |
OPS |
|
1 |
Cabrera |
1.078 |
|
2 |
Davis |
1.004 |
|
3 |
Trout |
.988 |
|
4 |
Ortiz |
.959 |
|
5 |
Goldschmidt |
.952 |
|
6 |
Tulowitzki |
.931 |
|
7 |
Werth |
.931 |
|
8 |
Votto |
.926 |
|
9 |
Cuddyer |
.919 |
|
10 |
McCutcheon |
.911 |
A comparison of these rankings using MOPS follows:
|
MOPS RANK |
PLAYER |
MOPS |
OPS RANK |
|
1 |
Cabrera |
1.083 |
1 |
|
2 |
Trout |
1.034 |
3 |
|
3 |
Davis |
1.008 |
2 |
|
4 |
Goldschmidt |
.967 |
5 |
|
5 |
Ortiz |
.965 |
4 |
|
6 |
McCutcheon |
.951 |
10 |
|
7 |
Werth |
.948 |
7 |
|
8 |
Cuddyer |
.934 |
9 |
|
9 |
Tulowitzki |
.933 |
6 |
|
10 |
Votto |
.931 |
8 |
As illustrated above, the rankings of eight of these ten players change when MOPS is used as the metric, and the changes are significant. Andrew McCutcheon (27 stolen bases) jumps all the way from tenth to sixth using MOPS, and Mike Trout leapfrogs slugger Chris Davis as runner-up, at 95% of Miguel Cabrera’s MOPS.
MOPS IS TOPS
We believe the data show that MOPS is the single-best measure of a player’s offensive value to his team. And we believe that the pendulum will continue swinging away from power-hitting towards power-pitching for the balance of the decade. This means that MOPS will continue to increase in importance as the single-best offensive measure of a player’s value to his team.
 Ultimately, WAR—wins above replacement—will emerge as the optimum measure of a player’s offensive value to his team. But WAR is still being perfected, and as long as WAR remains a “black box” metric, MOPS should be the universal standard for baseball fans.
It is good to see someone come up with a stat to credit a good base stealer. In today’s offensive hungry society, too many people over look the value a good base running team. MOPS adds a new dimention to capture some of that.
Nice to see Jackson working those stats! I hope he remembers me when he becomes famous!! 🙂
Excellent post. I used to constantly check this
blog aand I’m inspired! Very helpful information especially the ultimaate phase :
) I maintain such information a lot. I used to be looking for this
certain information for a very long time. Thank you and good luck.
I received a great email commenting on “MOPS” but before I could respond the email disappeared into the ionosphere! On the off chance–100-1–you come back to this feature, please email me at hcrehan@comcast.net. Fingers crossed!
I was at an Angel game tonight watching Trout and Otani and I was thinking about exactly what you have written. I have never seen anyone comment about what you call “MOPS” but am in total agreement with it. If a lumbering first baseman has the same OPS as Trout but Trout steals 24 of 26 bases it’s pretty clear who has more offensive value, all else being equal. MOPS evens out a HR hitter and a singles hitter who steals a lot of bases. Great article!